
Claim in 2019: Russia became stronger in 2019.
Source of the claim: Kremlin press secretary Dmitry Peskov on Channel 1 (December 2019)
Speaking on a Russian TV program that aired Dec. 14, 2019, Russian President Vladimir Putin’s spokesman Dmitry Peskov said: “Yes, I have no doubts about that,” when asked if Russia became stronger in 2019. Neither Peskov nor his interviewer specified whether, in their view, the increase in Russia’s strength was in absolute terms or relative to other countries or both.
Given this lack of specificity, we chose to measure and compare three key, widely recognized components of national power (economic growth, population and military expenditure) between 2018 and 2019 for Russia, the world as a whole, Russia’s global competitors, post-Soviet neighbors, oil producing countries and major developing nations—the countries relevant for Russia’s foreign policy. We also calculated changes in power for Russia and these countries by using variations of three well-known formulas to assess the power of states. Only one formula, the Experimental Index of National Power (EINP), which we based on Ray Cline’s approach toward measuring national power, confirms Peskov’s claim. This is largely due to the increase of an intangible factor included in the formula, the World Bank’s effectiveness of government index, that grew in Russia between 2018 and 2019. On key tangible components such as national power, economy and population, however, Russia's rate of growth lagged behind major developing nations, most developed Western countries and the world in general.
Russia’s population in absolute numbers marginally declined (-0.07 percent) from 2018 to 2019, and since the global population continued to grow, Russia’s share in the global population declined even further: by 1.13 percent, or from 1.90 percent of the global population to 1.88 percent. Russia’s GDP grew by 1.34 percent from 2018 to 2019, but this growth was less than 50 percent of the global 2.93 percent, so Russia’s share in global GDP slid by 1.55 percent, from 3.10 percent of total global GDP to 3.05 percent. In the meantime, Russia’s military expenditures grew faster than that of the rest of the world, at 4.5 percent versus 0.4 percent, so Russia’s share in global military expenditures grew by 0.9 percent, from 3.32 percent of the global aggregate to 3.35 percent.
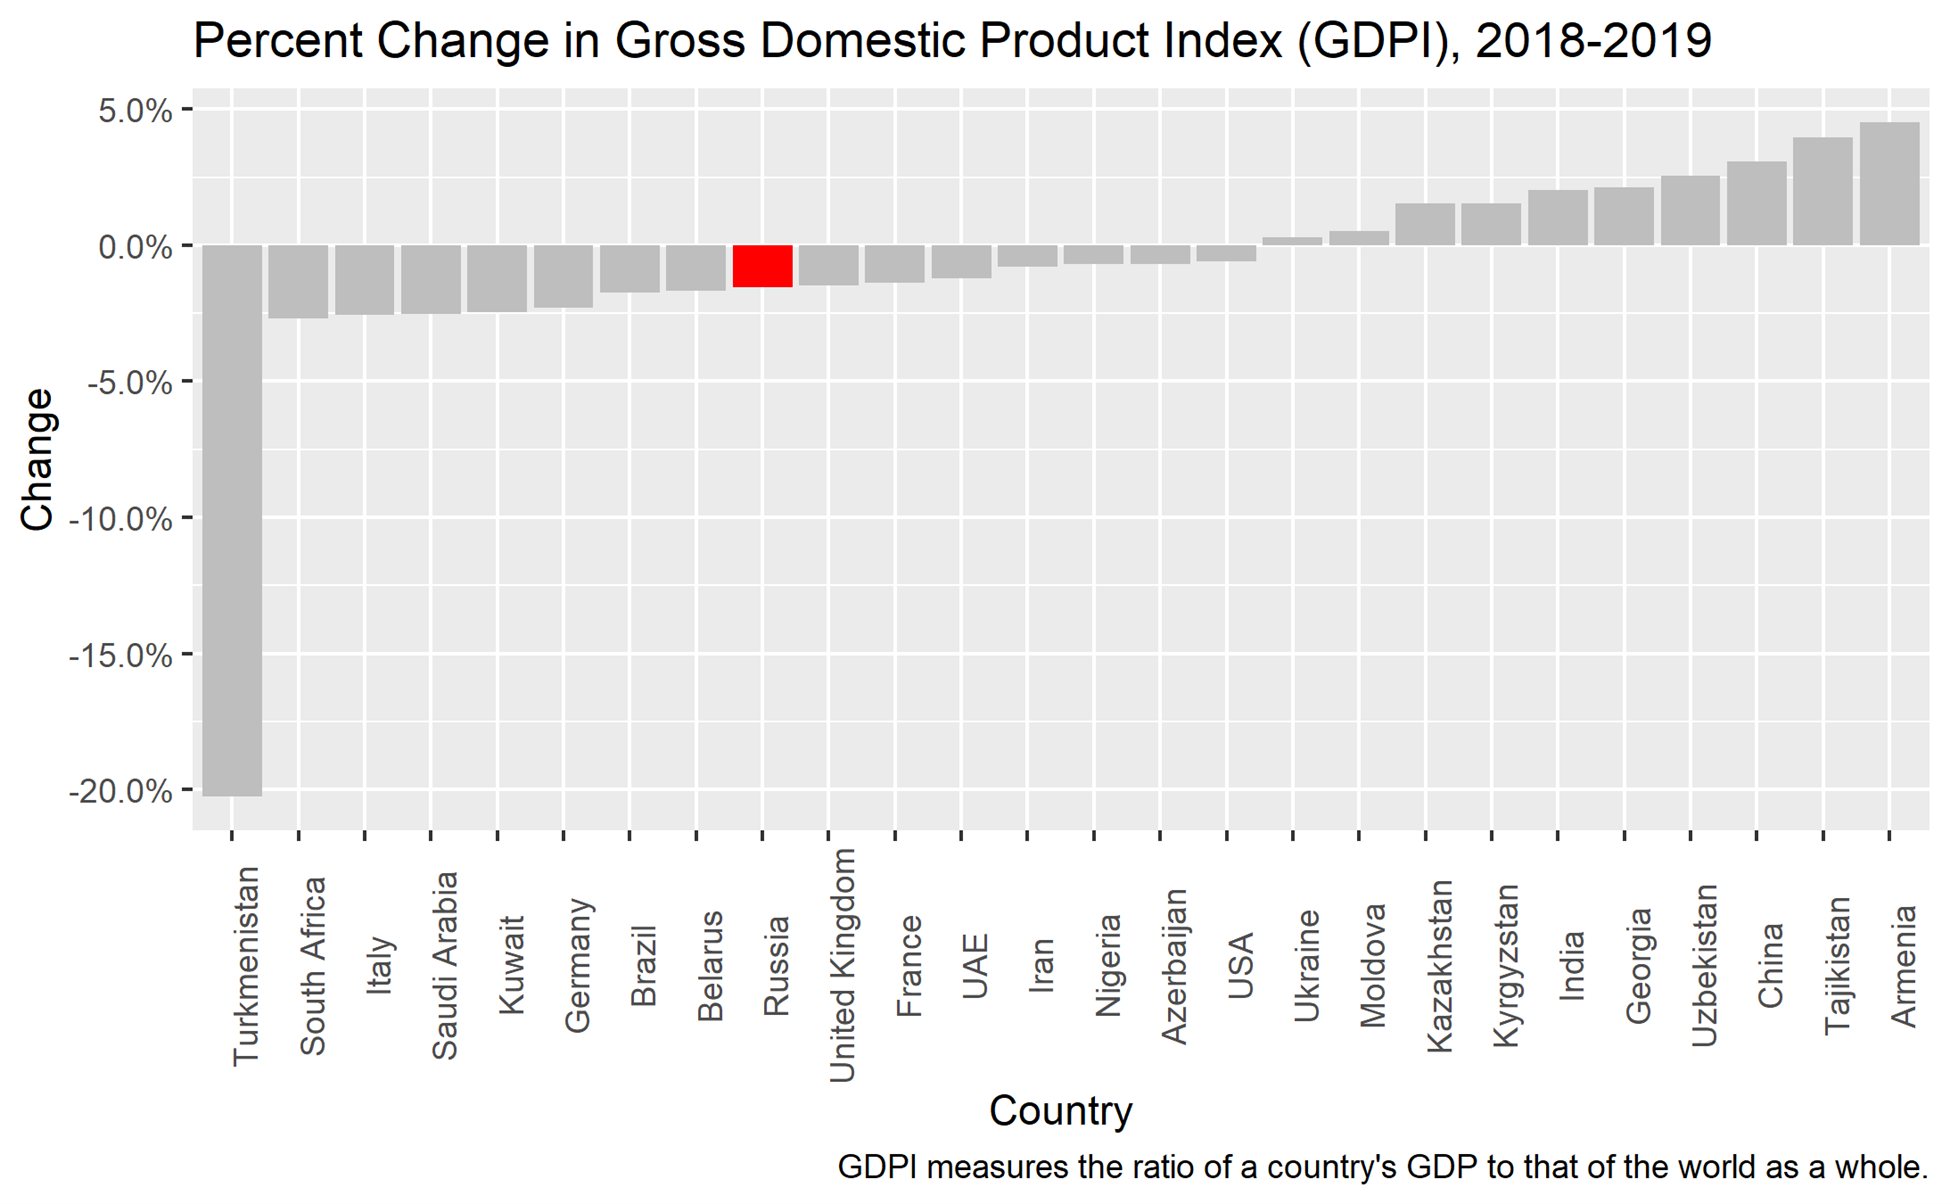
But despite higher-than-average military expenditures increases, Russia was outpaced by both China and the U.S. on both growth and absolute numbers of all three key components of national power: GDP, population growth and military expenditures. If we employ the Gross Domestic Product Index (GDPI) measurement, which is based on counting states’ economic power only, then we would arrive at the conclusion that Russia’s power declined by 1.5 percent, while that of the U.S. declined by only 0.6 percent and China’s grew by 3.1 percent in 2018-2019. If one were to compare the absolute volume of Russia’s national power with that of the U.S. and China per the GDPI method, then it would transpire that Russia was more than five times weaker than China and the United States (3.05 percent of global power versus 17.33 percent and 15.79 percent, respectively) in 2019. Other large powers, like Germany and India, also saw their power grow, if measured by GDPI, in that period. Some states’ power did decrease along with Russia’s: oil producing states such as Saudi Arabia, Kuwait and Nigeria also declined in 2019 in comparison to 2018, as their GDPs grew at a slower pace than the global average. This can be partially explained by the decline of oil prices from 65.23 USD on average in 2018 to 56.99 USD in 2019. Interestingly, all other former Soviet republics, except oil-dependent Azerbaijan, Kazakhstan and Russia-dependent Belarus, grew faster than Russia in economic might, both in absolute numbers and as shares of global power.
Figure 1:1
Combining these and other components of national power, we employed three different multi-variable approaches for calculating that power (formulas employed in these approaches can be accessed here). Two show a relative decline in power; one shows growth.
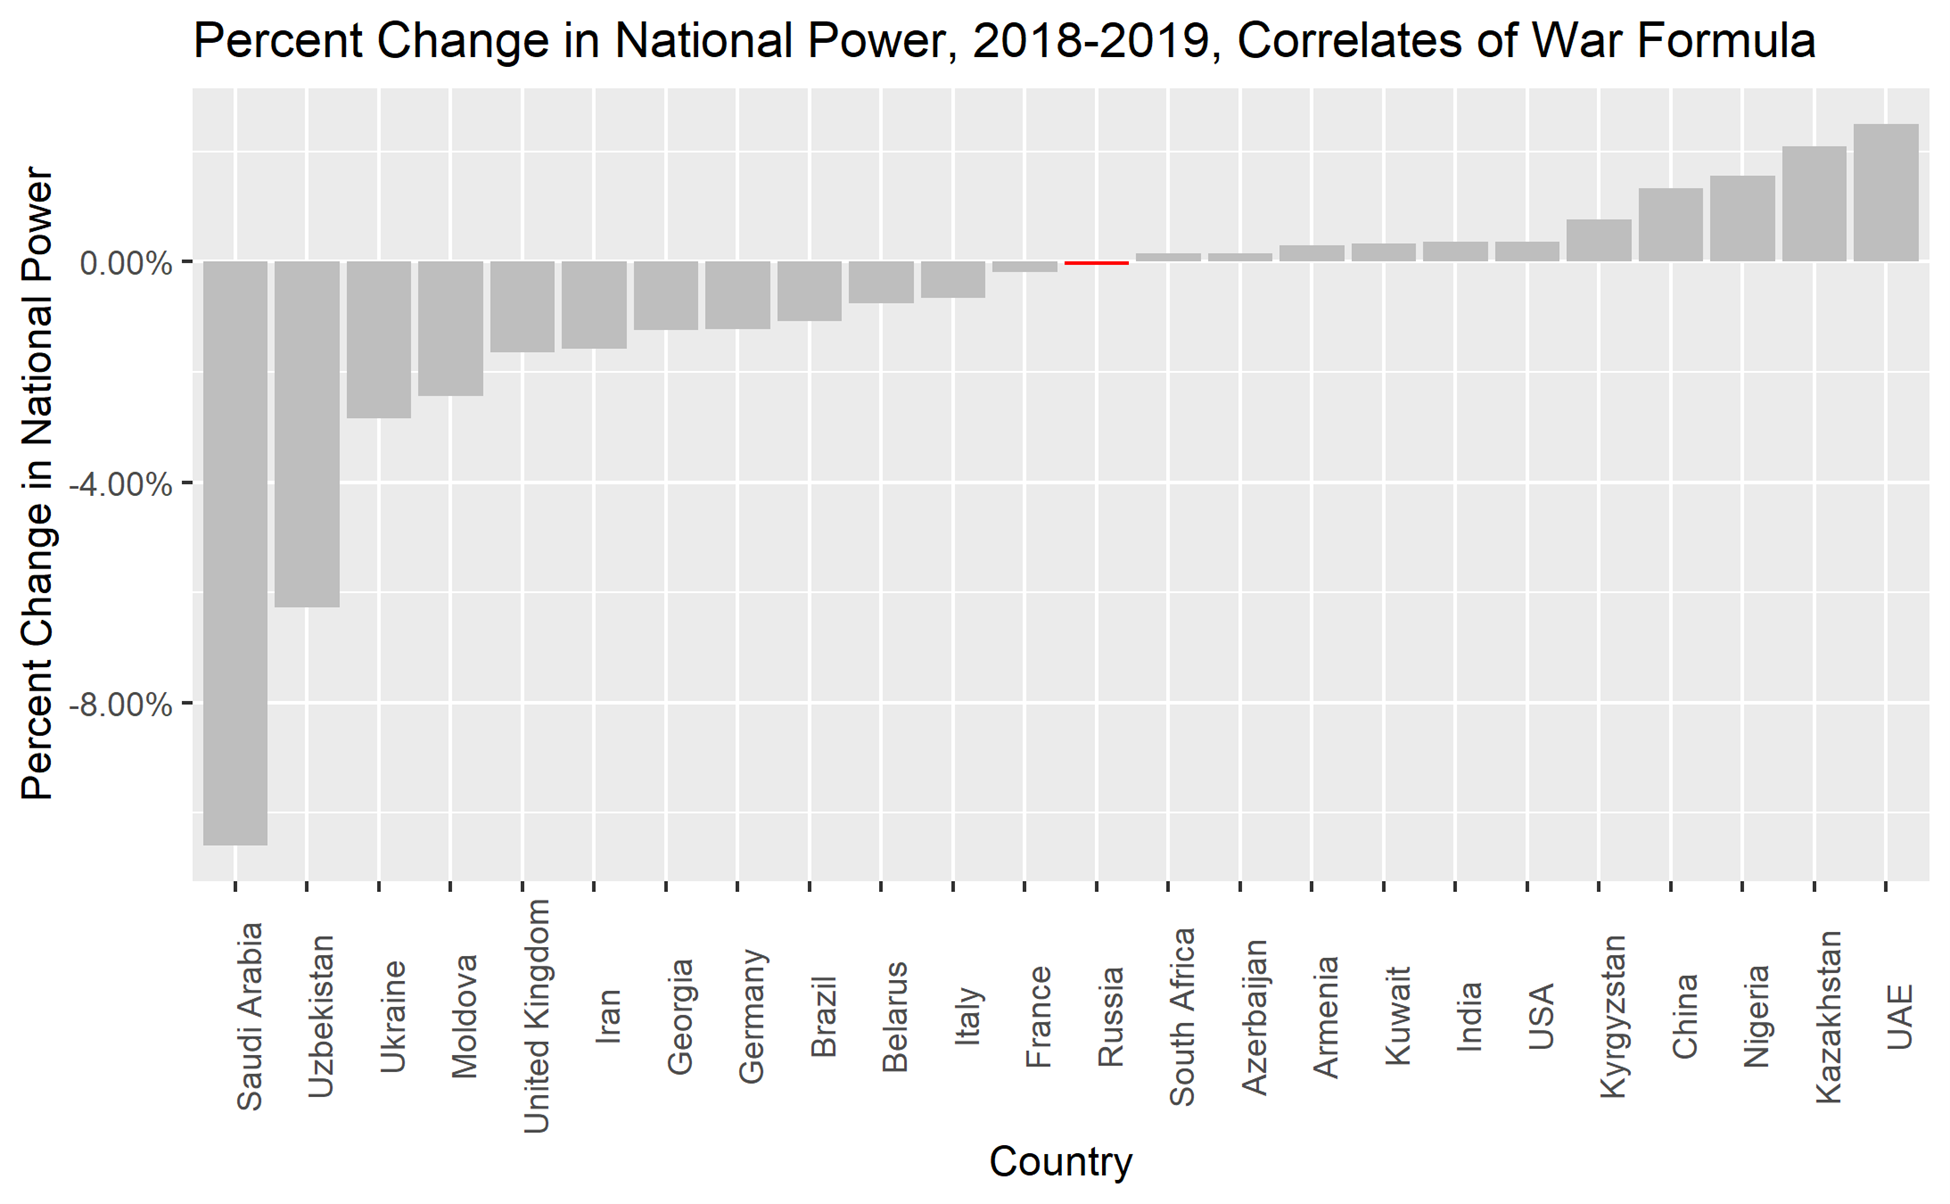
1. Correlates of War formula—decline: Using the Correlates of War formula, Russia held 2.7 percent of global power while China had 20.8 percent and the U.S. had 14.4 percent in 2019. Russia’s share of global power declined slightly by 0.05 percent from 2018, while America’s grew by 3.7 percent and China’s by 1.3 percent. Post-Soviet countries showed mixed results, with Armenia, Azerbaijan and Central Asian republics growing faster than Russia, and Ukraine, Georgia, Moldova and Belarus lagging behind. This formula emphasizes population strength, and the results in the former Soviet Union clearly reflect the countries’ population trends. Ukraine was the strongest among them, but with only 0.44 percent of global power, it was still more than five times weaker than Russia. Saudi Arabia demonstrated a precipitous decline of 10.6 percent in 2019, but nonetheless remained the strongest among oil-dependent countries, holding 1.2 percent of global power. Germany and India were stronger than Russia in 2018 and 2019 by this measure as well.
Figure 2:
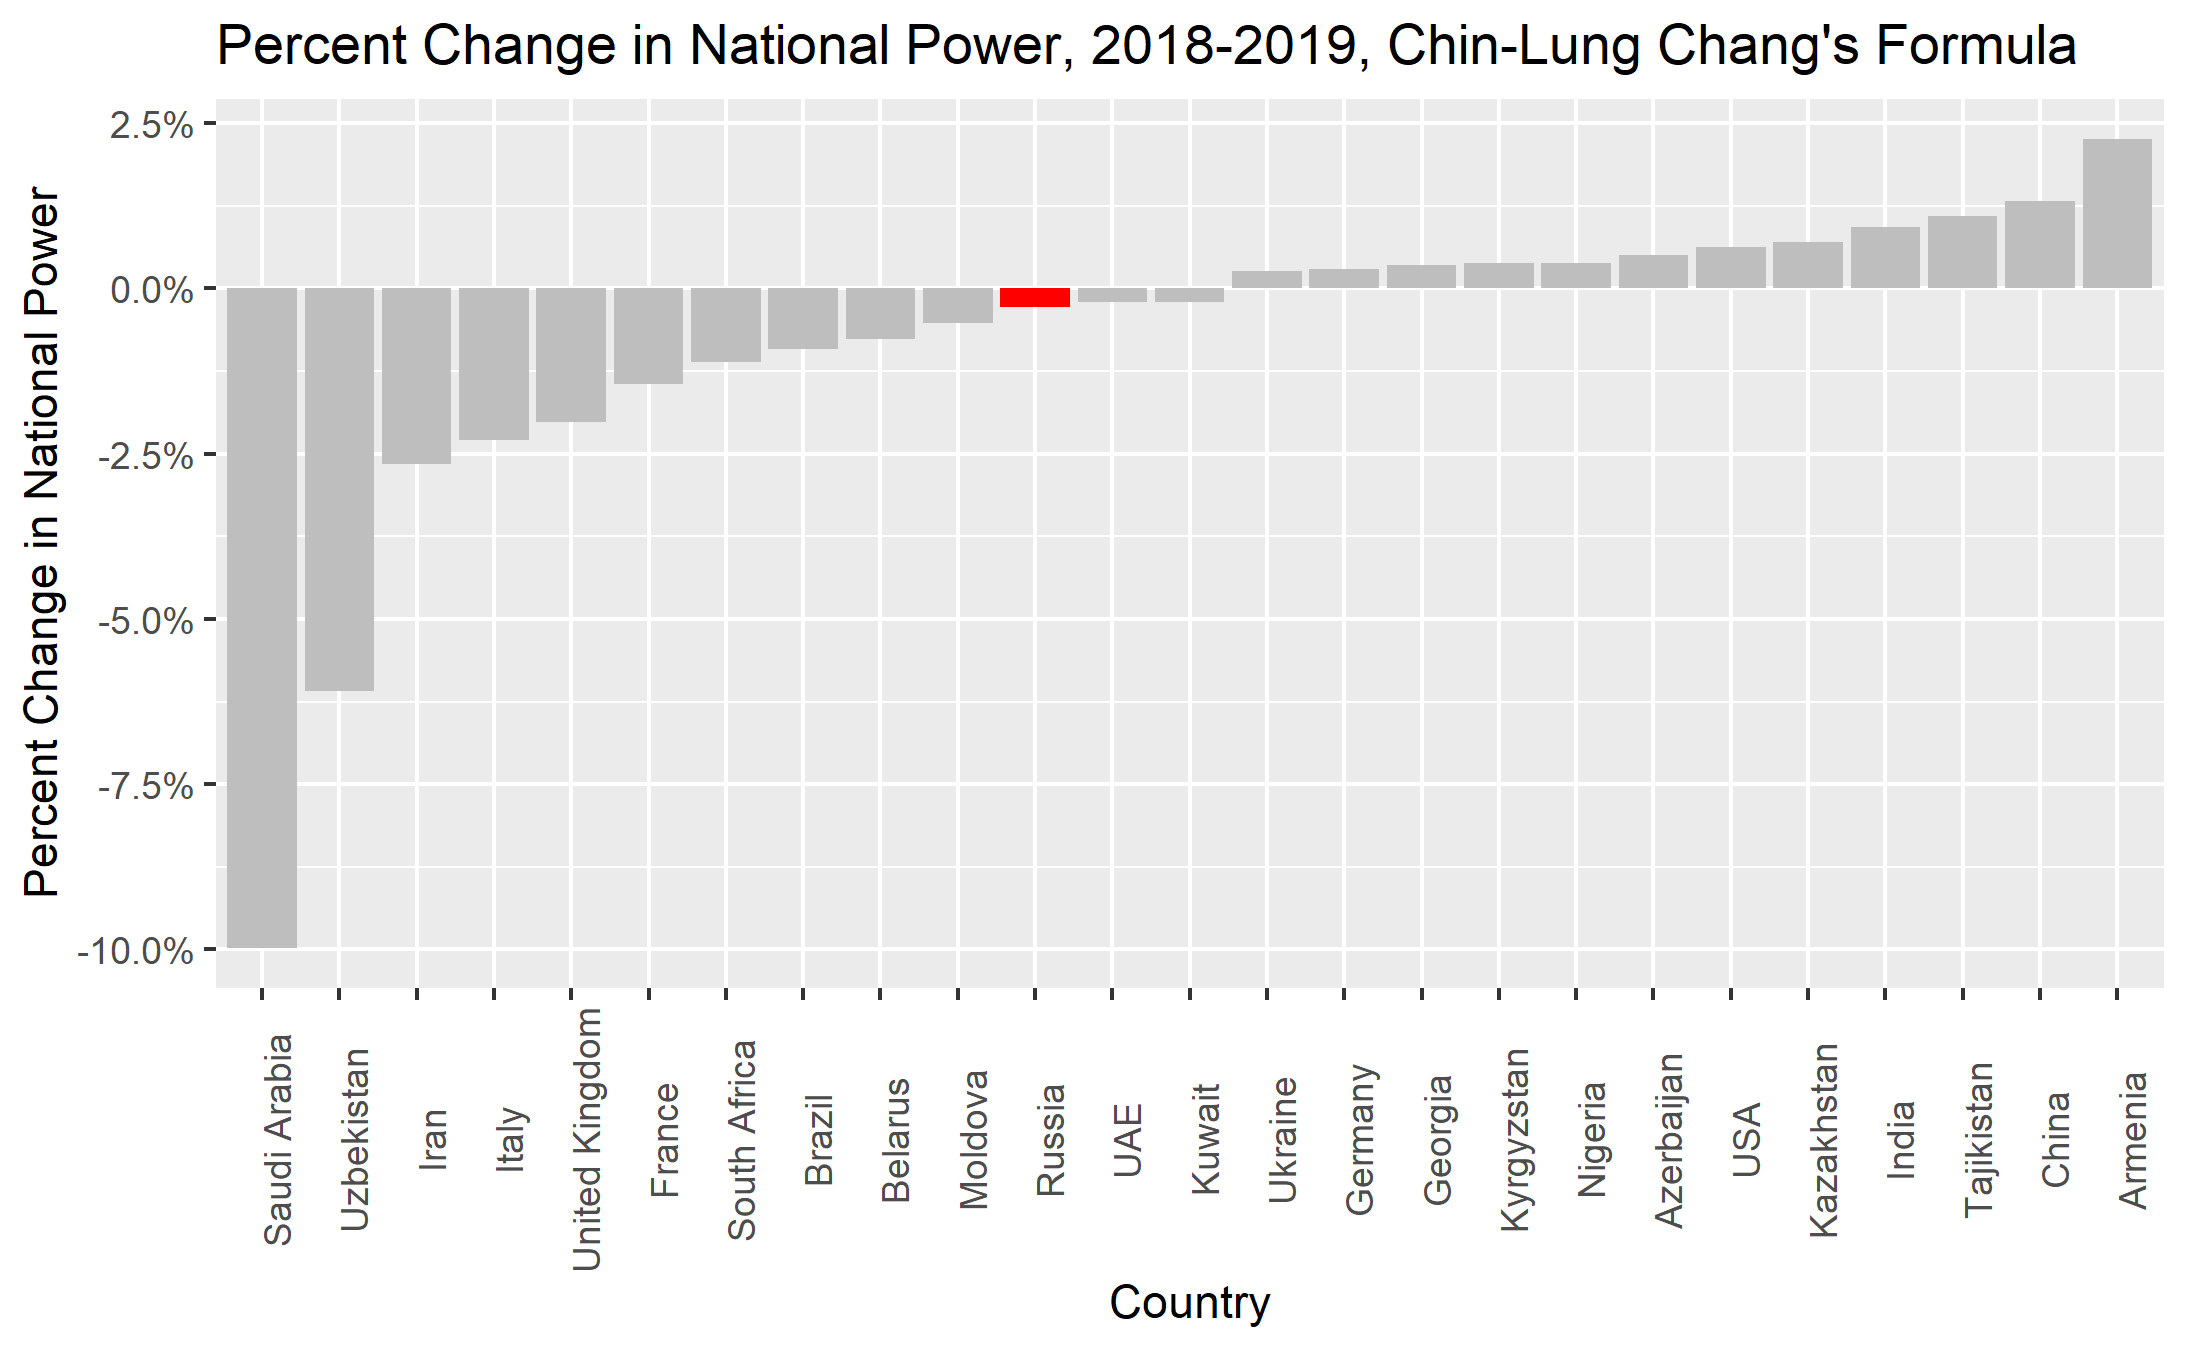
2. Chin-Lung Chang’s formula—decline: Analyzing Russia’s power using Taiwanese scholar Ching-Lung Chang’s formula shows that Russia’s power declined slightly, by 0.56 percent from 2018 to 2019. China, in the meantime, grew by 1.3 percent and the U.S. by 0.7 percent. In absolute terms, Russia remained about three times weaker than China (indicator of 7.56 versus 21.83) and the U.S. (24.23) in 2019. India (11.5) was stronger than Russia, but Germany (3.06) was much weaker. Kazakhstan came in as the second strongest post-Soviet country, but it was still seven times weaker than Russia. Nevertheless, all post-Soviet countries, except Belarus, Moldova and Uzbekistan, were growing faster than Russia. Saudi Arabia was the strongest among oil-producers, but still remained three times weaker than Russia.
Figure 3:
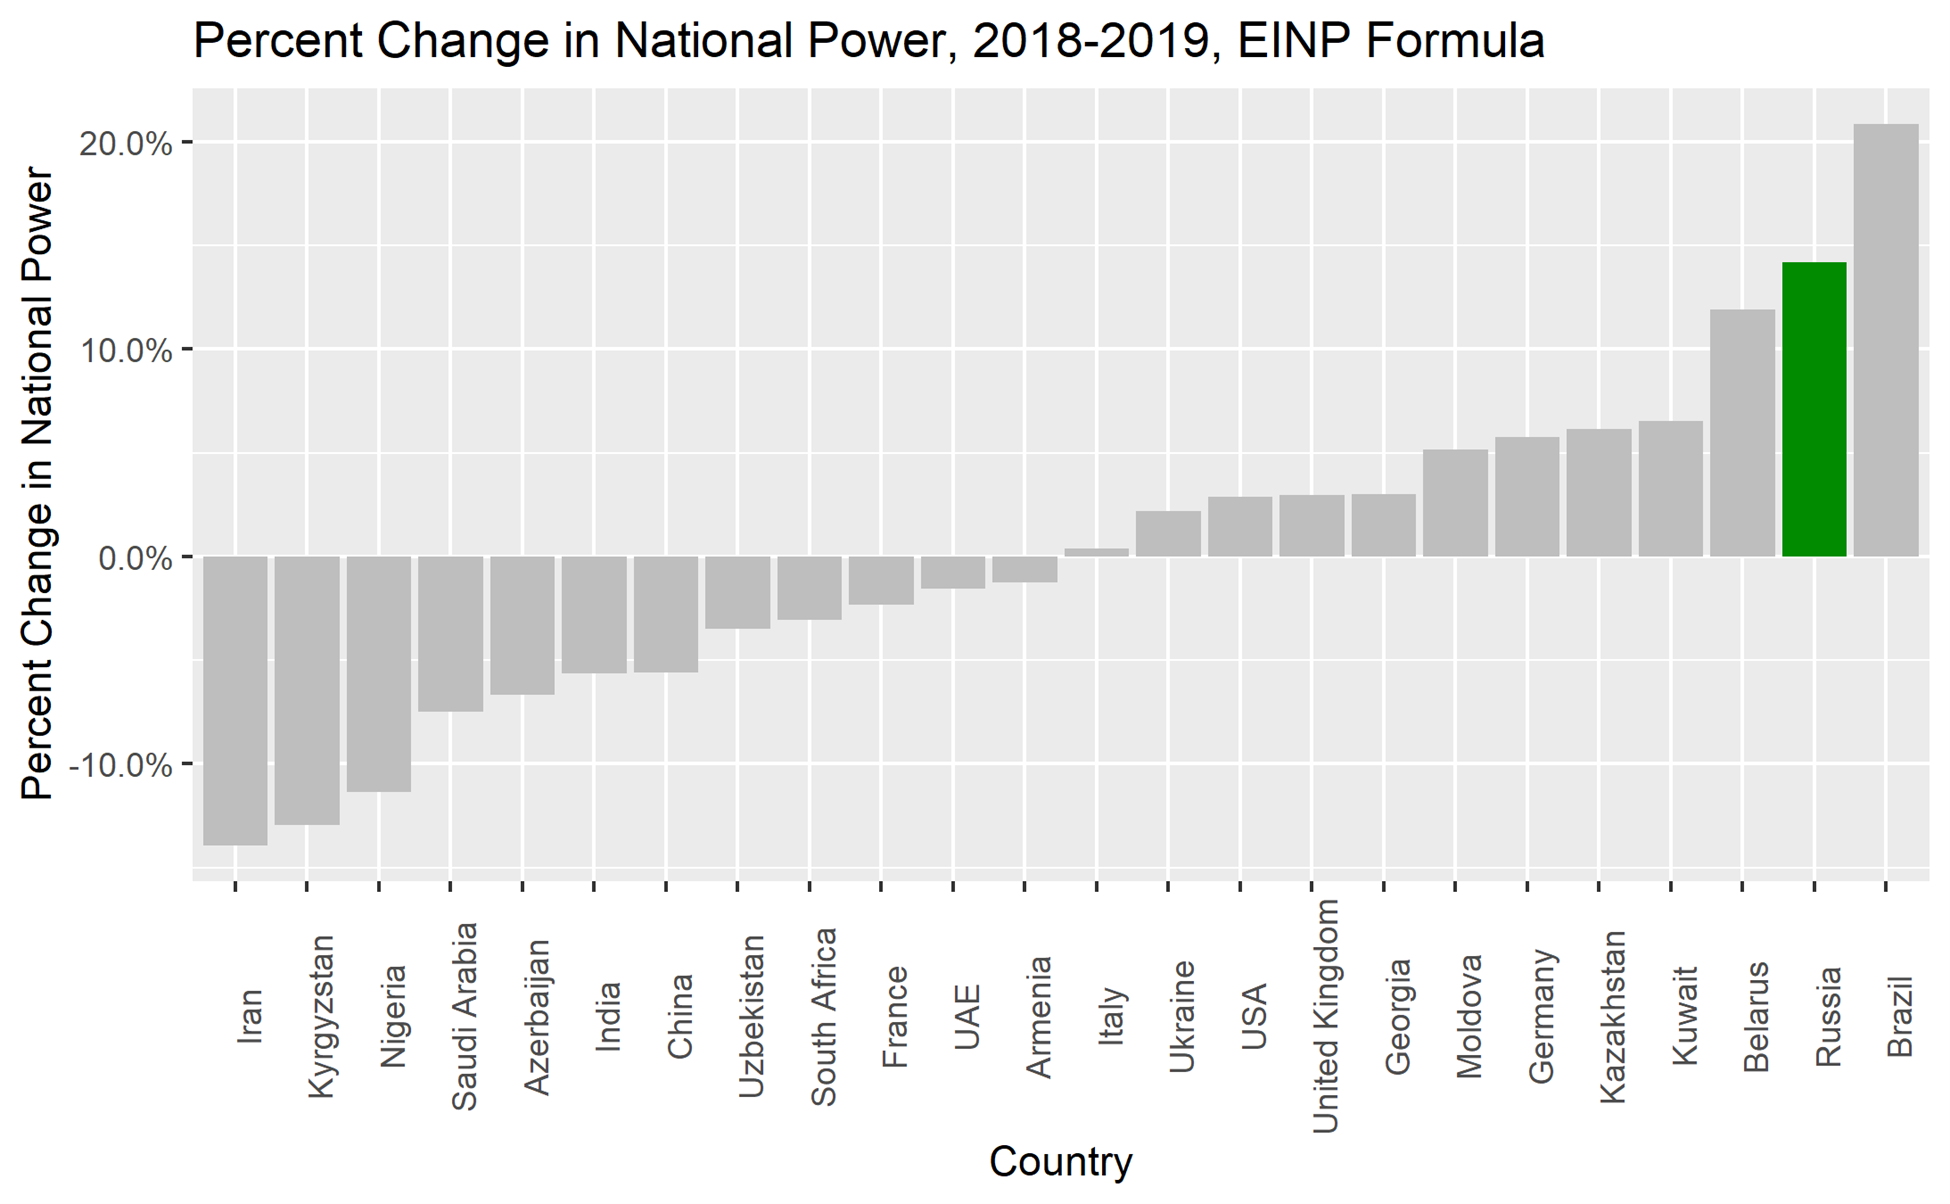
3. EINP formula—growth: The EINP method gave Russia 14.2 percent growth between 2018 and 2019. The reason for this is that despite the decline or stagnation in most other components of national power in this formula, the World Bank's effectiveness of government indicator for Russia jumped from the 50.96 to the 58.14 percentile rank, or by 14.15 percent, between 2018 and 2019. China’s power declined by 5.6 percent and the U.S. grew by 2.9 percent in the same period. In absolute numbers, Russia, with an absolute value of 24.33 in 2019, trailed the United States (117.05), China (109.05) and India (35.02). Post-Soviet republics showed a variety of dynamics, from 11.9 percent growth in Belarus to a 13 percent decline in Kyrgyzstan. Kazakhstan was the strongest of the post-Soviet states after Russia, with an absolute value of 3.22, still about seven times weaker than Russia. Among oil-dependent states, Saudi Arabia was the strongest in 2019, with a value of 6.55, despite declining 7.5 percent from the previous year.
Figure 4:
Overall, while the EINP formula shows that Russia’s national power did increase from 2018-2019, Chin-Lung Chang’s formula and the Correlates of War formula indicate that Russia’s national power has decreased over this period, meaning that while one measure does indeed confirm Peskov’s statement, two others do not.