
The Russia-Ukraine War Report Card, March 5, 2025
Find past issues in the Russia-Ukraine War Report Card archive.
March 4 update: Russian gains slowed to 140 square miles of Ukraine’s territory (about 1 1/2 Martha’s Vineyard islands) in the past month. In Russia’s Kursk Oblast, Ukraine lost 4 square miles in the past week. Zoom out from the battleground into international relations, and you will be confronted with news reports that U.S. military aid to Ukraine has been suspended and that U.S. intelligence sharing with Ukraine has been cut off as a result of Zelenskyy’s Feb. 28 bust-up with Trump and Vance in the White House. If protracted, the suspension of supplies of the following U.S. military equipment will have the greatest negative impact, according to the Economist, WSJ and Istories: Patriots, HIMARS and ATACMS. As hurtful, if not more, would be rendering Starlink inoperable in Ukraine, according to FT. Unless the suspension is lifted, Ukraine will run out of its last American military supplies in “two or three months,” according to a senior Ukrainian official.
Who’s Gaining and Who’s Losing What?
Territorial Control (figures as of March 4, 2025)
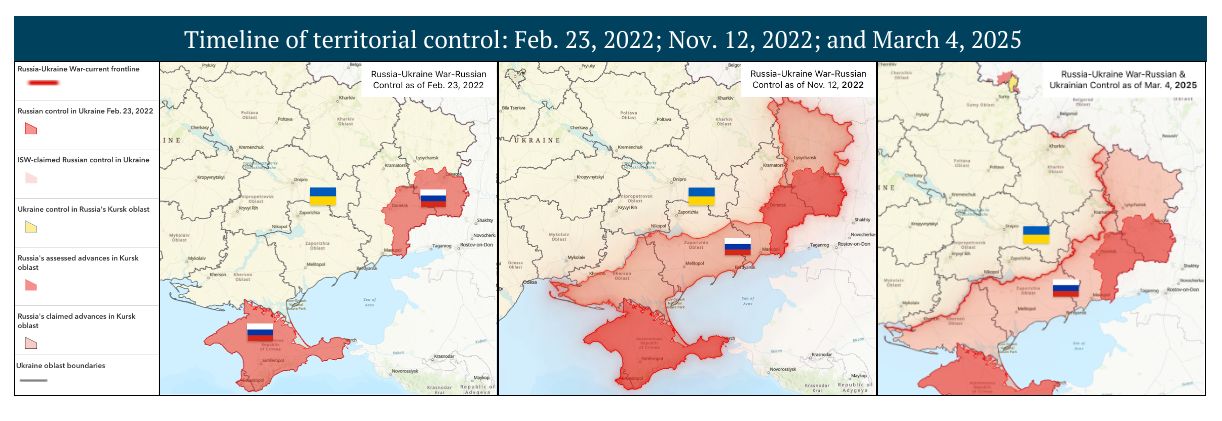
For a higher-resolution image, click here (full screen button in top right).

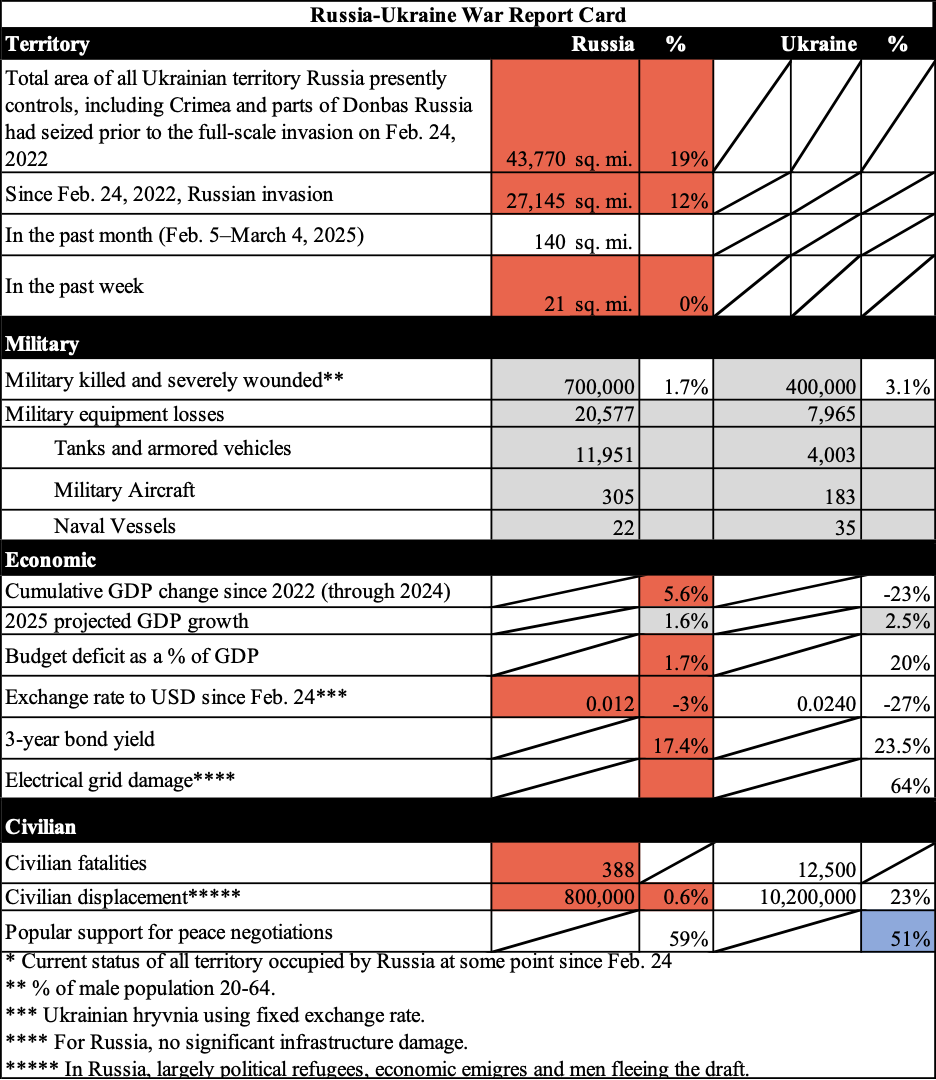
Report Card*
Change in Russia’s control of Ukrainian territory.
(Based on data from the Institute for the Study of War.)
- Since Feb. 24, 2022:
- Russia: +27,145 square miles. 12% of Ukraine. (Area roughly equivalent to half the size of New York state).1
- Total area of all Ukrainian territory Russia presently controls, including Crimea and parts of Donbas Russia had seized prior to the full-scale invasion on Feb. 24, 2022:
- Russia: +43,770 square miles. 19% of Ukraine. (Area roughly equivalent to the U.S. state of Virginia.)
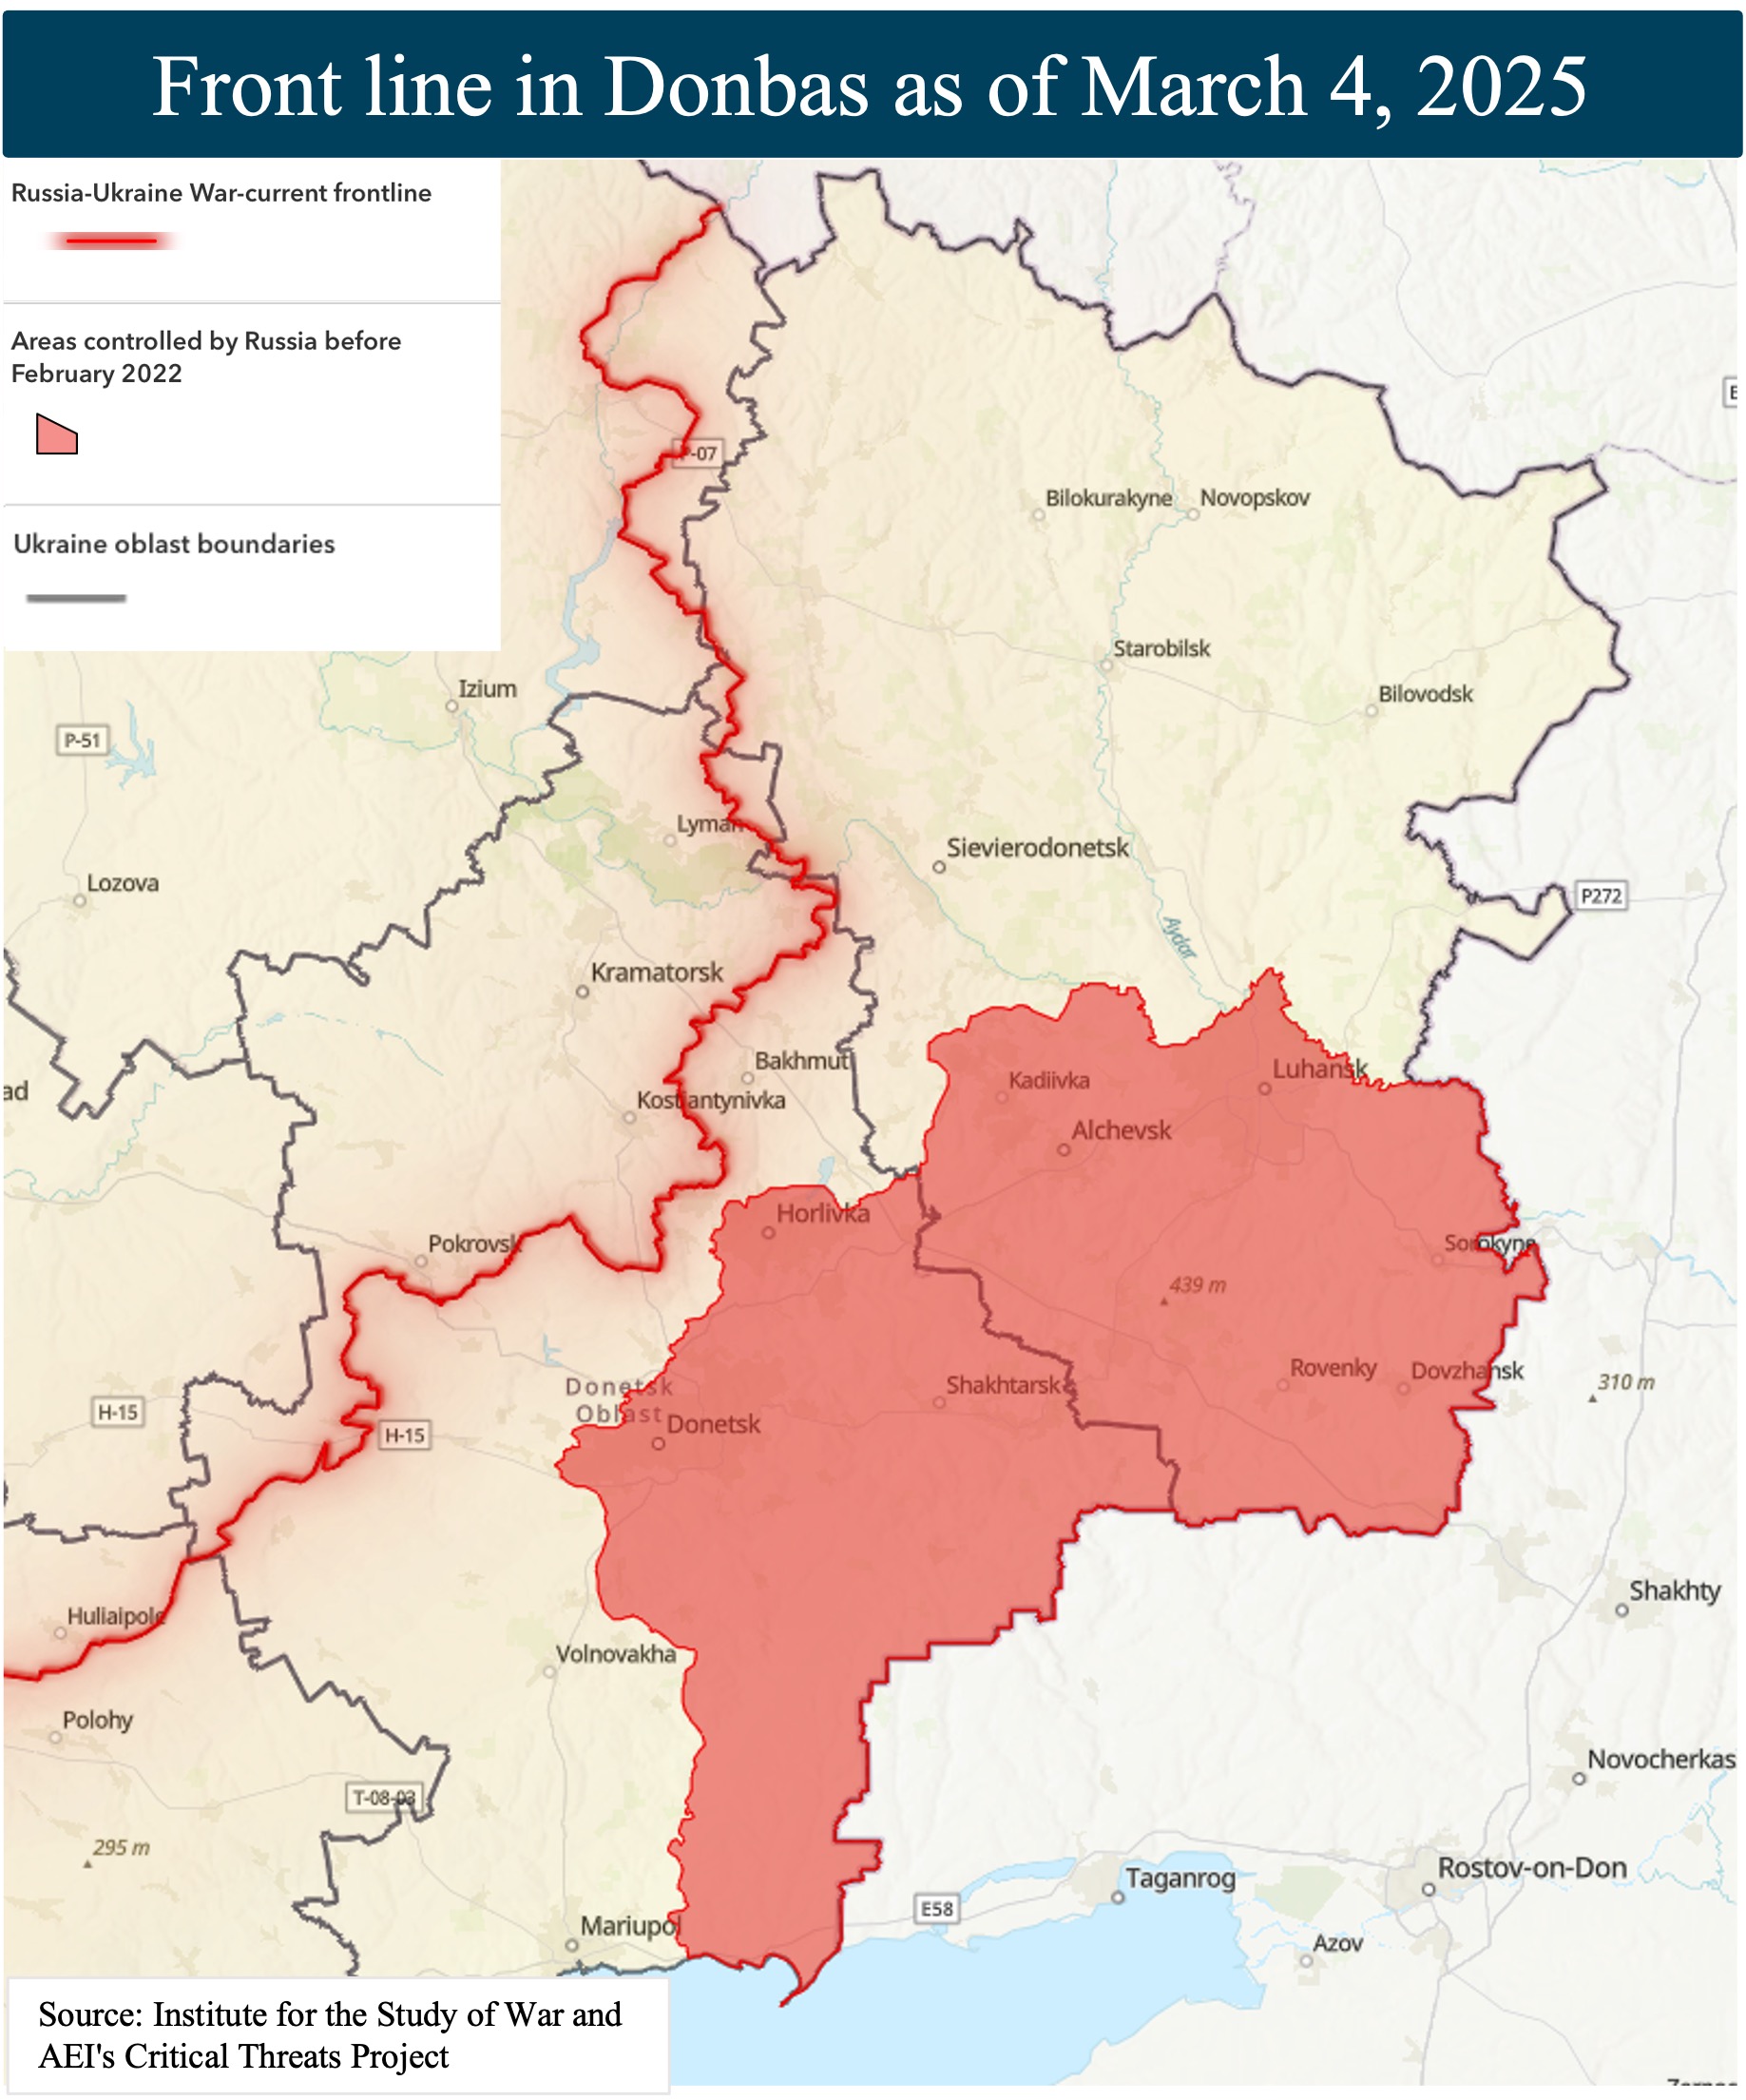
- In past month (Feb. 5–Mar. 4, 2025): Russia gained 140 square miles. Area roughly equivalent to about 1 1/2 Martha’s Vineyard islands.2
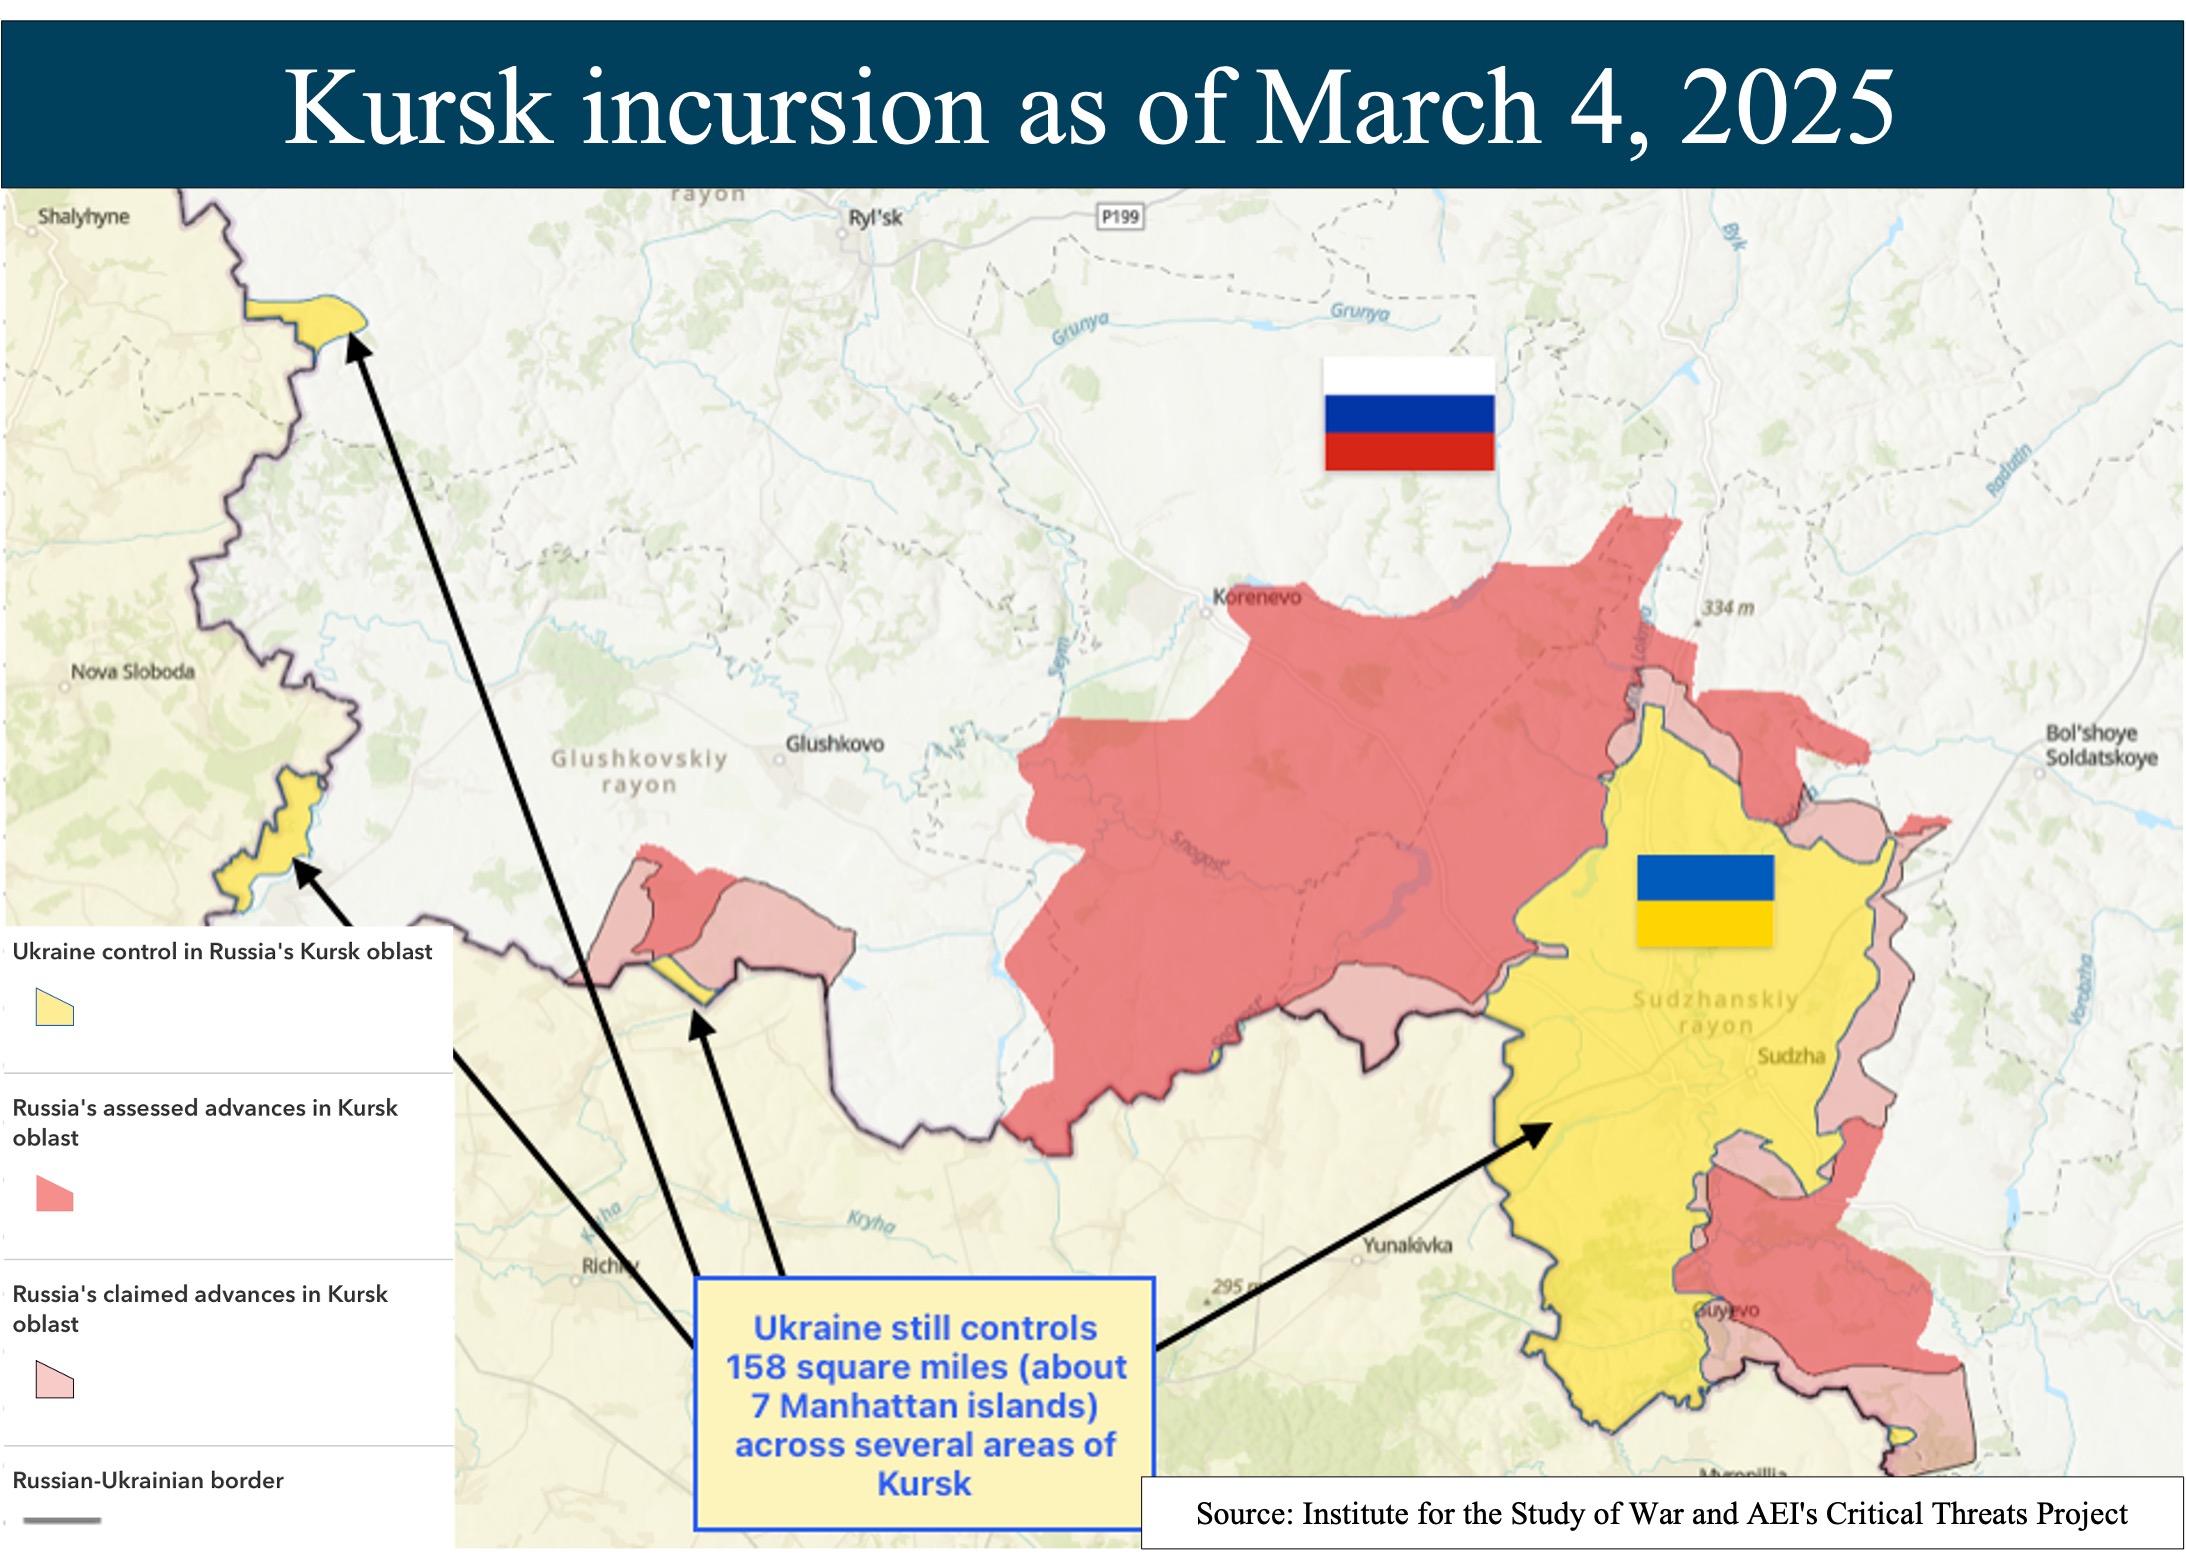
- In past week: Russia gained 21 square miles, the equivalent of 1 Manhattan island.
- Ukraine lost 4 square miles in Russia’s Kursk Oblast.
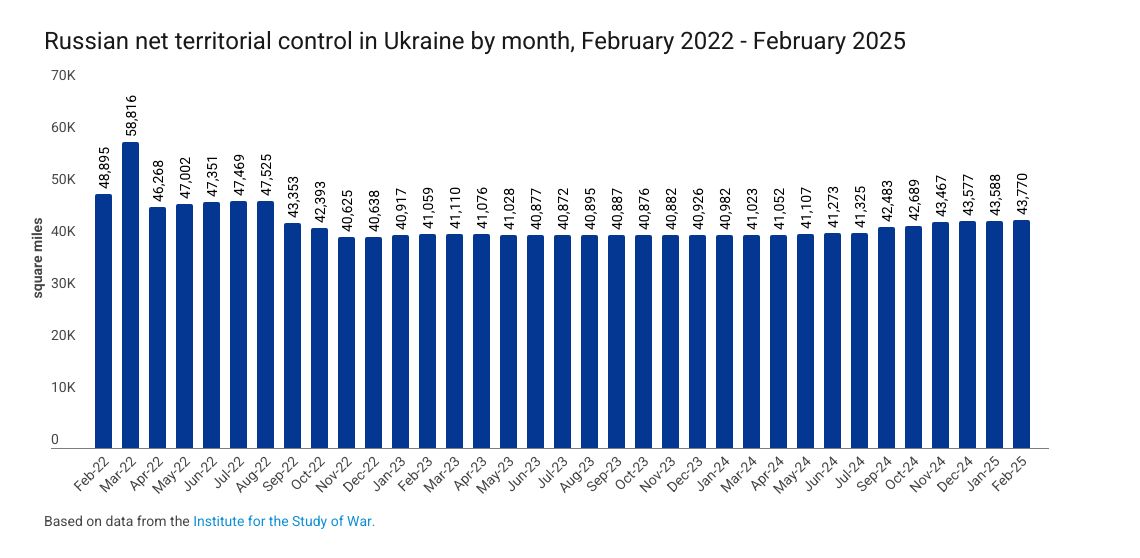
Russian net territorial control in Ukraine by month: February 2022–February 2025.(Also based on data from the Institute for the Study of War.)
Military casualties
- Russia: More than 700,000 killed or injured, according to a January 2025 estimate.3 48,000 missing.
- Ukraine: 400,000 killed or injured, according to a January 2025 estimate.4 35,000 missing.
Civilian fatalities
Military vehicles and equipment5
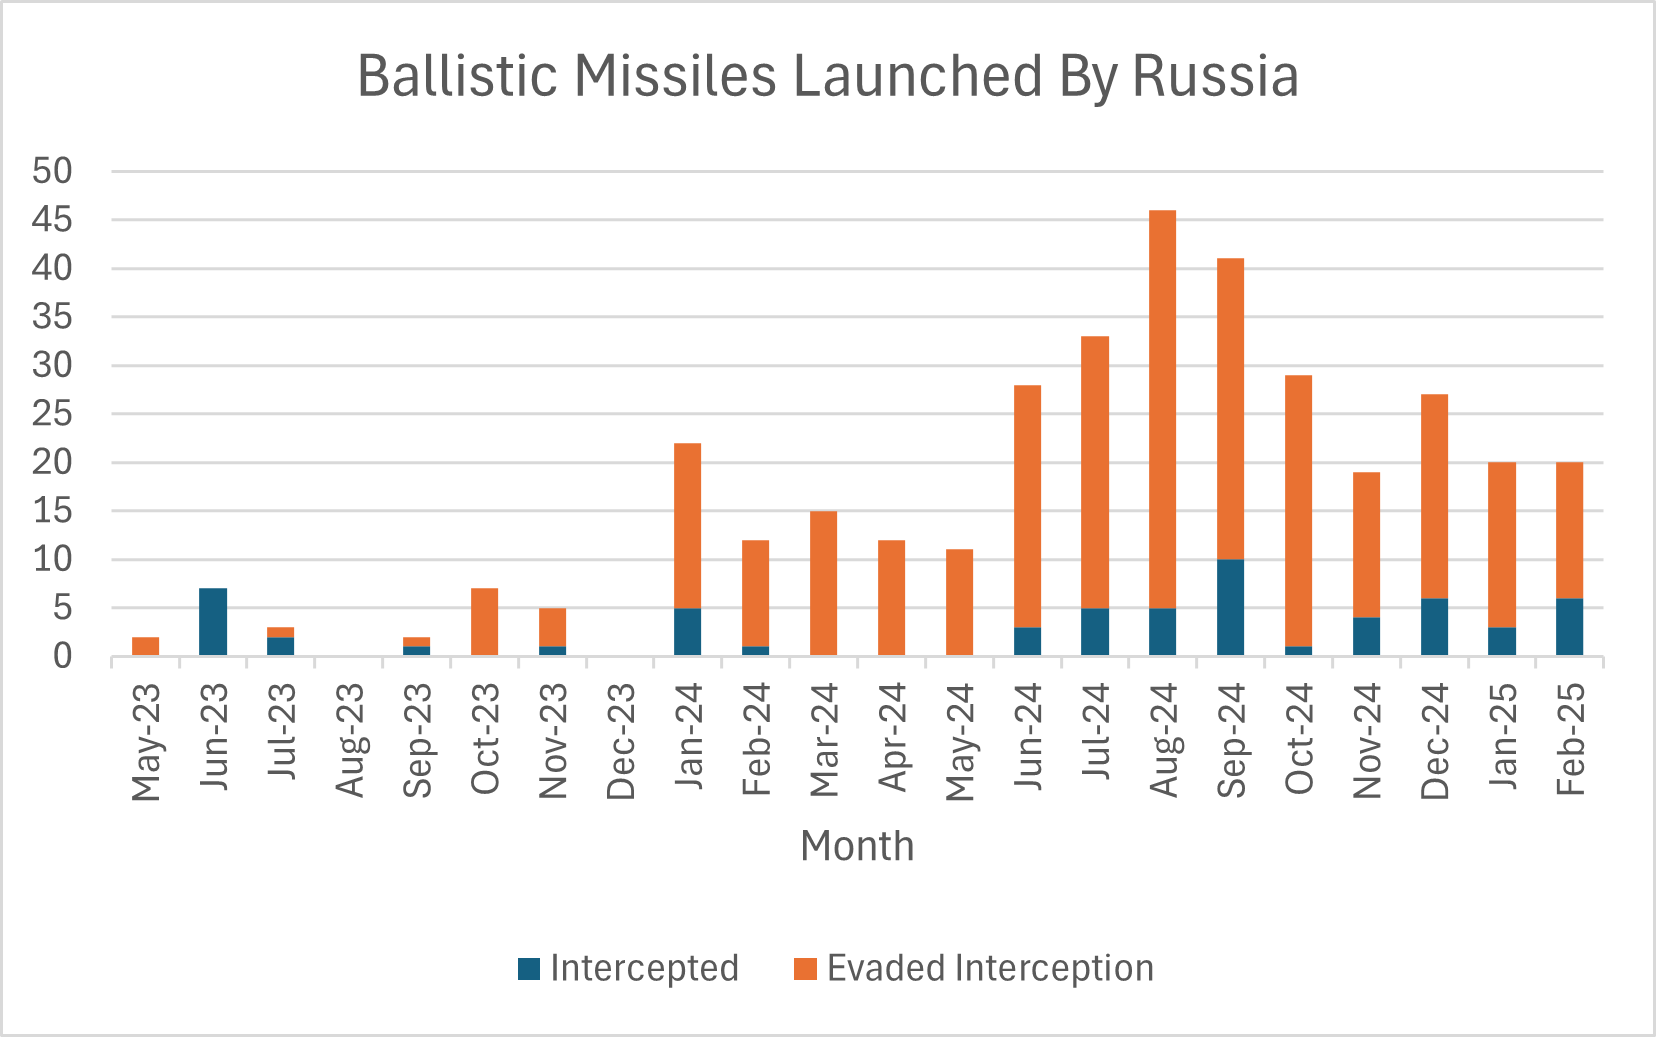
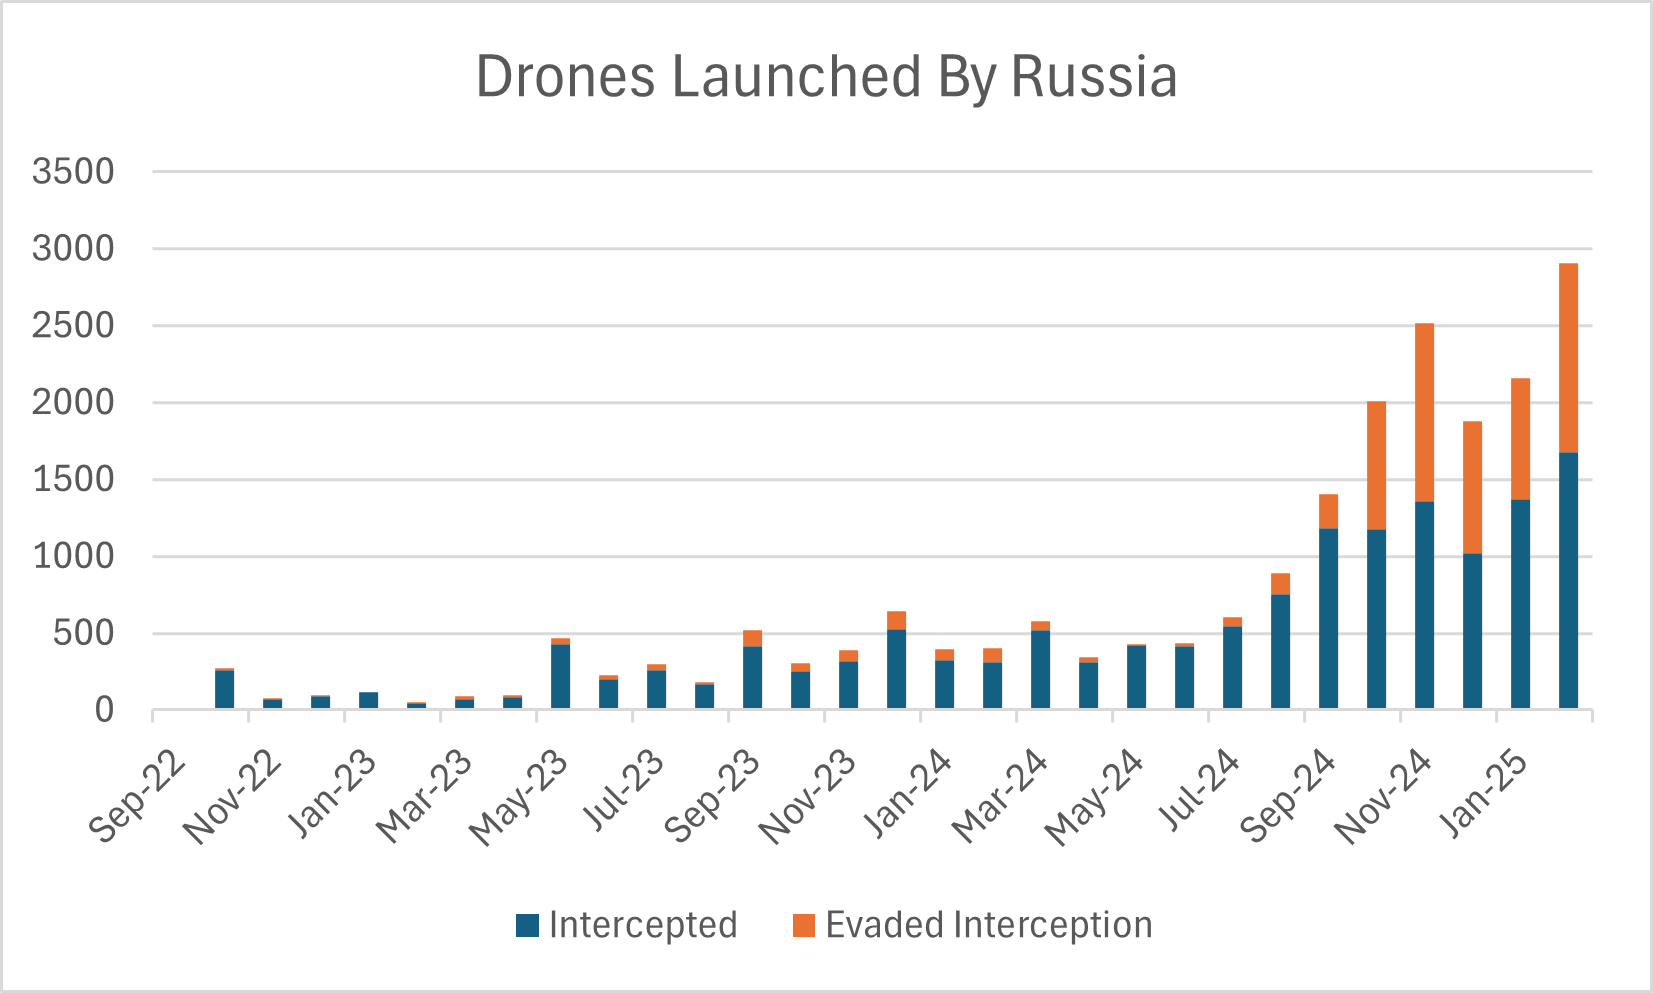
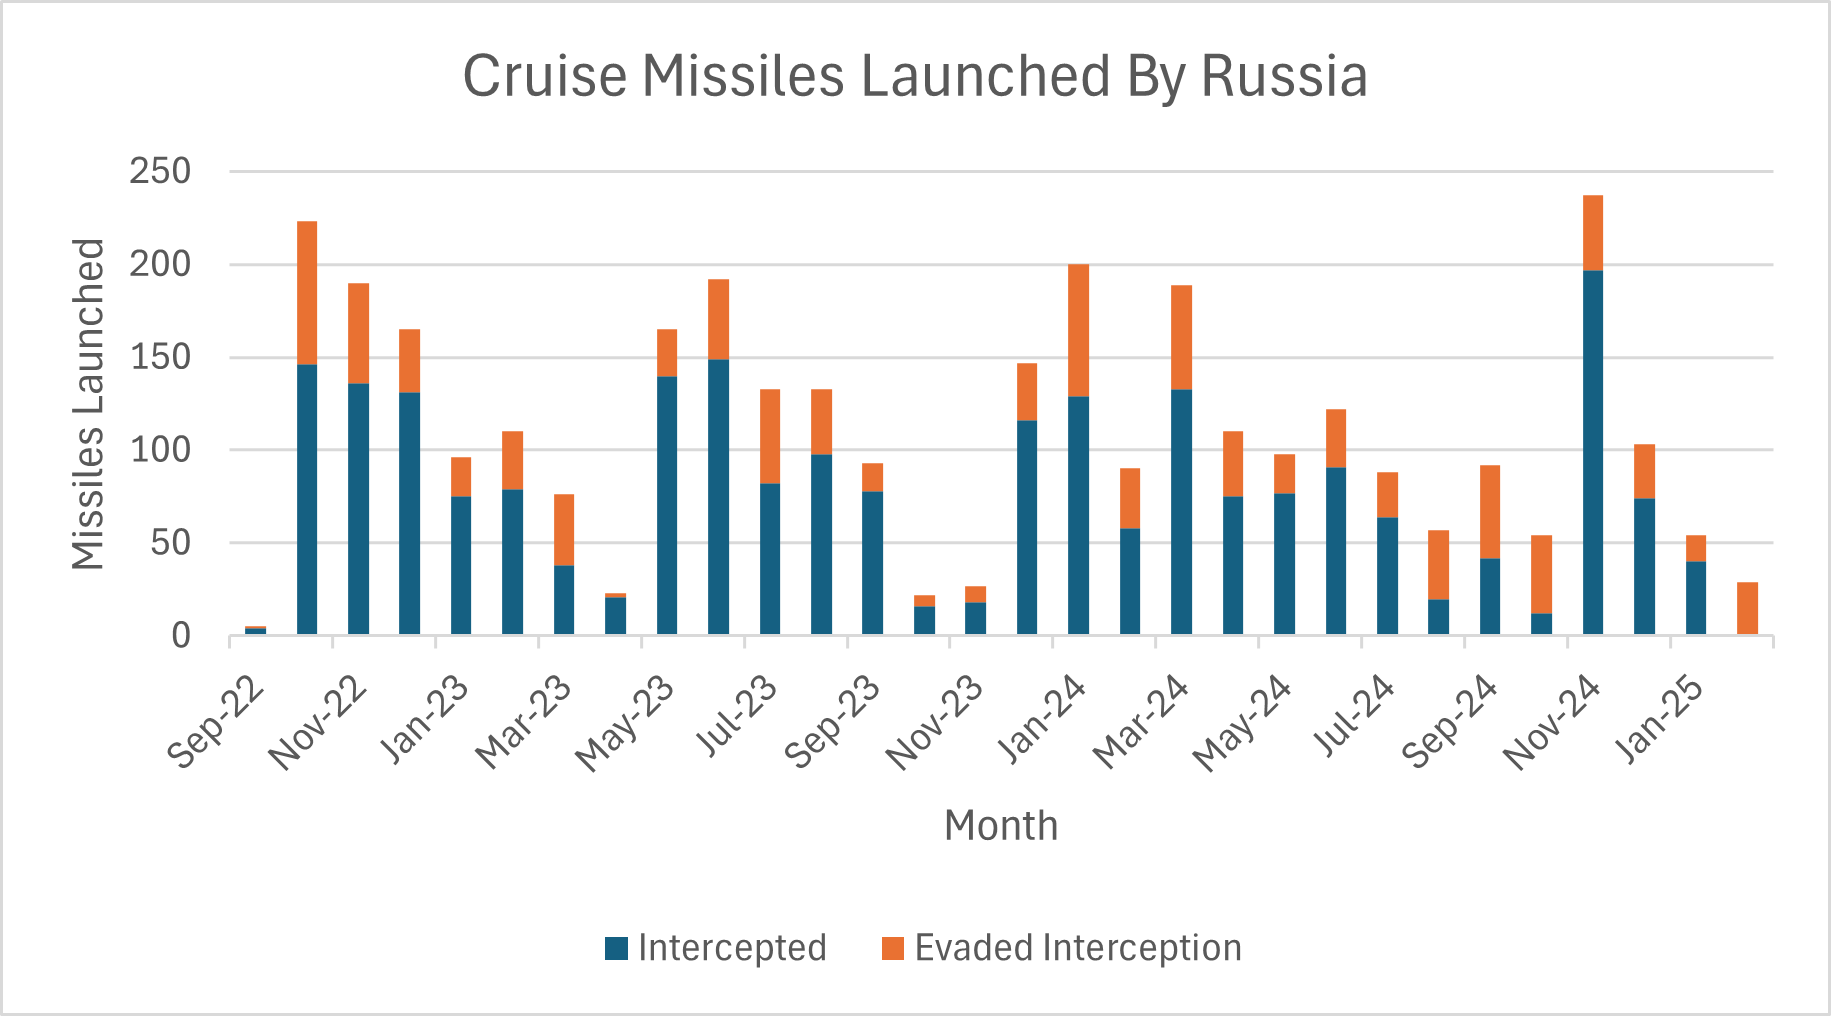
Russian aerial attacks and Ukrainian interceptions 8
In February 2025:
- Russia launched
- 20 ballistic missiles
- 2,905 drones
- 29 cruise missiles
- Ukraine intercepted
- 6 ballistic missiles
- 1,675 drones
- 0 cruise missiles
Since September 2022:
- Russia launched
- 361 ballistic missiles
- 20,778 drones
- 3,323 cruise missiles
- Ukraine intercepted
- 60 ballistic missiles
- 14,695 drones
- 2,339 cruise missiles
Citizens displaced
- Russia: 800,000 emigrated for economic or political reasons, 0.6% of Russian population.
- Ukraine: 10.2 million displaced Ukrainians, 23% of Ukrainian pre-invasion population of 44 million.
Economic impact9
- Russia’s economic growth: 5.6% GDP since 2022 (through 2024)
- 1.6% GDP growth forecast for 2025.
- Budget deficit in 2024: 1.7% of GDP.
- Russian ruble: 0.0115 U.S. dollars. -3% since invasion.
- 3-year bond yield: 17.42%10
- Ukraine’s economic growth (negative): -22.6% GDP since 2022 (through 2024)
- 2.5% GDP growth forecast for 2025.
- Budget deficit in 2024: 20.4% of GDP, excluding grants.
- Ukrainian hryvnia: 0.024 U.S. dollars. -27% since invasion.
- 3-year bond yield: 23.5%
Infrastructure
- Russia: A journalistic investigation estimated in March 2024 that Ukrainian strikes had rendered facilities which accounted for 1/6th of the production of gasoline and diesel fuels in Russia non-operational.
- Ukraine: 64%, or 36 out of 56 GW electricity generating capacity destroyed or occupied, Ukraine relies for 2/3rds of its electricity generation on three functioning Soviet-era NPPs, which it still controls.
Popular support
Other criteria which may be even more important (about which we continue to search for reliable indicators):
- Ammunition supply
- Foreign military aid
- Force generation
- Military leadership
- Training
- Morale
- Control of strategic locations
- Information war: with U.S./Europe; with world.
Footnotes
- According to Ukraine’s DeepState OSINT group’s map, as of March 4, 2025, Russian forces occupied 112,358 square kilometers of Ukrainian land (43,382 square miles), which constituted 18.6% of Ukrainian territory, and which is roughly equivalent in area to the U.S. state of Virginia.
- In the past 30 days, Russian forces made a gain of 333 square kilometers (128.5 square miles) in Ukraine, according to a March 3, 2025 estimate by the Economist.
- According to Donald Trump’s January 2025 estimate, 1 million Russian soldiers have been killed.
- According to Trump’s January 2025 estimate, 700,000 Ukrainian soldiers have been killed.
- Oryx, “Attack On Europe: Documenting Equipment Losses During The 2022 Russian Invasion Of Ukraine,” Oryx (blog), https://www.oryxspioenkop.com/2022/02/attack-on-europe-documenting-equipment.html; “The Military Balance 2022,” IISS, https://www.iiss.org/publications/the-military-balance/the-military-balance-2022; Oryx, “List Of Aircraft Losses During The Russian Invasion Of Ukraine,” https://www.oryxspioenkop.com/2022/03/list-of-aircraft-losses-during-2022.html; Oryx, “List Of Naval Losses During The Russian Invasion Of Ukraine,” https://www.oryxspioenkop.com/2022/03/list-of-naval-losses-during-2022.html.
- Not being updated as of 2025.
- Not being updated as of 2025.
- Jensen, Benjamin and Yasir Atalan, “Russian Firepower Strike Tracker: Analyzing Missile Attacks in Ukraine,” Center for Strategic and International Studies, December 17, 2024, https://www.csis.org/programs/futures-lab/projects/russian-firepower-strike-tracker-analyzing-missile-attacks-ukraine?f%5B0%5D=content_type%3Aarticle&f%5B1%5D=content_type%3Areport Note that due to limitations associated with refreshing of attack and intercept data, this section of the scorecard is updated once a month.
- International Monetary Fund, World Bank, and Russian estimates. “Russia and Ukraine 3-Year Bond Yield,” Investing.com, https://www.investing.com/rates-bonds/russia-3-year-bond-yield; World Bank Group, “Europe and Central Asia Economic Update,” https://openknowledge.worldbank.org/server/api/core/bitstreams/94bdc078-9c64-4833-992a-fda7b3d1a640/content; World Bank, “Russian Federation MPO,” https://thedocs.worldbank.org/en/doc/d5f32ef28464d01f195827b7e020a3e8-0500022021/related/mpo-rus.pdf; Investing.com, “Russia 3-Year Bond Yield,” https://www.investing.com/rates-bonds/russia-3-year-bond-yield; World Bank, “The World Bank in Ukraine,” https://www.worldbank.org/en/country/ukraine/overview#3; https://www.exchange-rates.org/exchange-rate-history/rub-usd-2024-11-01.
- Not being updated as of 2024.
*This card is being produced by RM staff and Belfer Center Avoiding Great Power War Project researcher Quinn Urich.